The margin keeps widening
Raw F1 is the wrong number to look at. Here's the one we watch instead, and why it has grown at every QGI release since February.
Every time a forecasting model ships a new version, the question is the same: is it actually better? F1 is the default answer: a single number between 0 and 1 summarising precision and recall.
The problem with F1 alone is that it depends on how hard the evaluation set is. If you change the set of countries you evaluate on, or the set of events you score against, F1 moves for reasons that have nothing to do with the model itself. You can watch F1 tick up while your model is quietly getting worse: the eval just got easier.
Margin over persistenceis the metric that keeps us honest. It subtracts the F1 of a trivial baseline (“next year's events equal this year's events”, i.e. persistence) from the model's F1. If the eval set changes, both numbers move together. The gap is what the model is actually contributing.
The last three releases
Here is the trajectory for QGI's scoring releases since February:
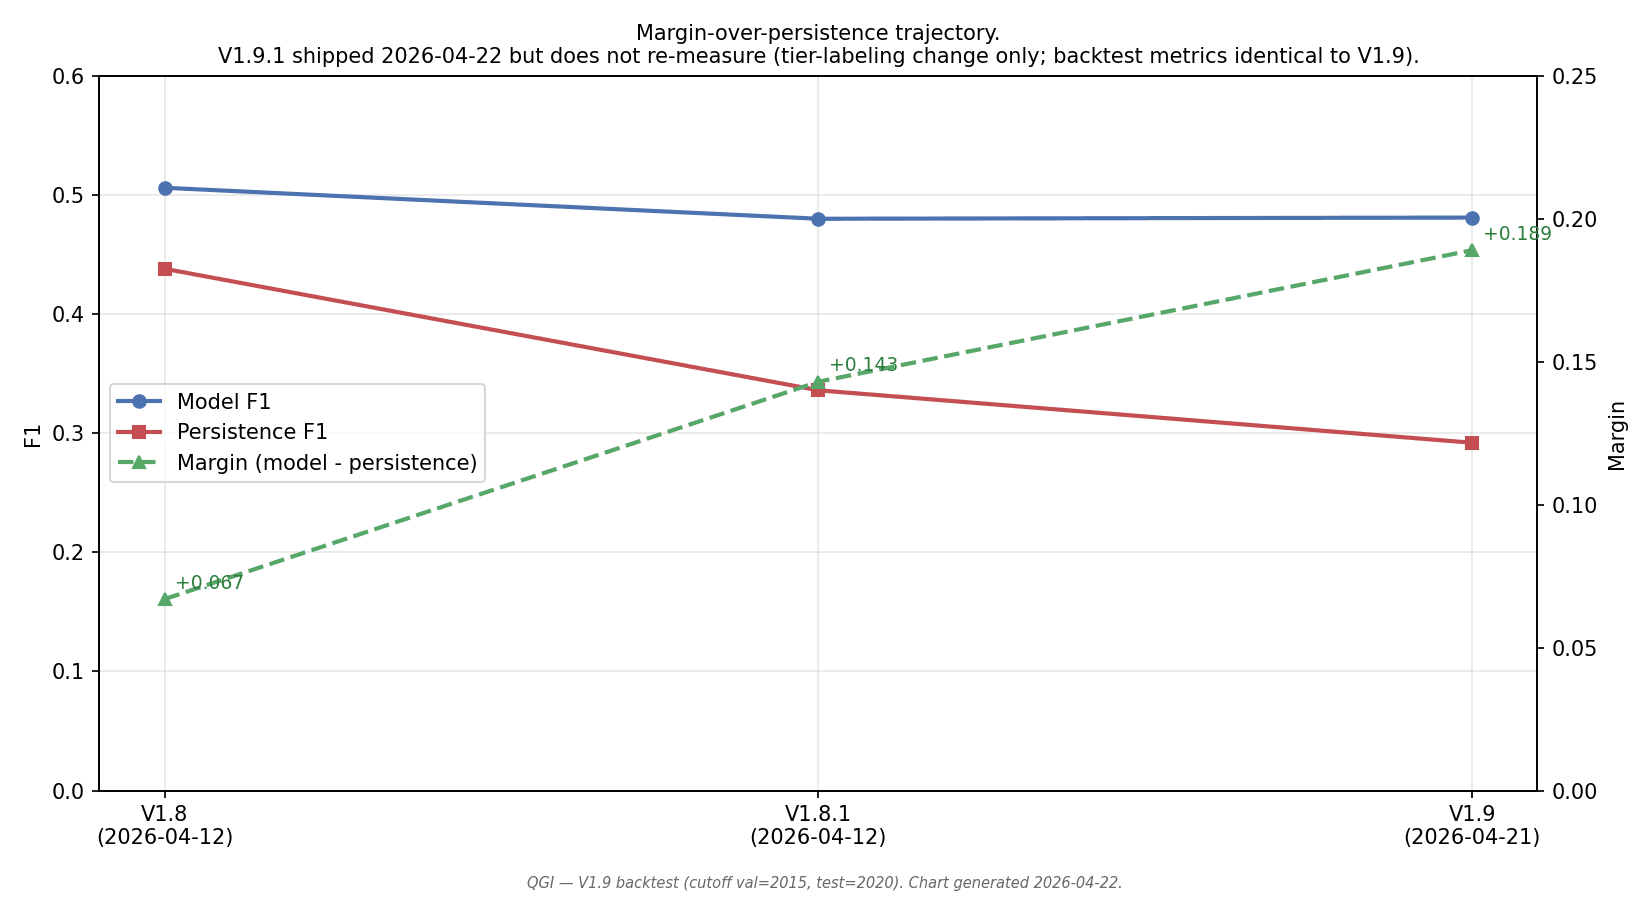
Three releases, three margins: +0.067 (V1.8, mid-April), +0.143 (V1.8.1, a week later), +0.189 (V1.9, this past week). Model F1 has oscillated between 0.48 and 0.51 the entire time. Persistence F1 has been crushed: 0.438 → 0.336 → 0.292.
That pattern is load-bearing. It says the model has kept its absolute performance while the eval has gotten progressively harder on the naïve baseline. The naïve baseline is what we have to beat to justify shipping. The gap is the amount of real signal in the output.
Where the widening actually came from
This is the part where it's tempting to claim the model is getting smarter. It isn't, or at least not in proportion to the margin growth. Most of the gap widening comes from the evaluation harness getting more honest:
- V1.8 → V1.8.1introduced category-stratified risk-tier labels. The ground-truth set grew from 294 to 403 pairs as more countries came into curated coverage. Persistence tanked because the new harder countries were exactly the ones that don't repeat year-over-year.
- V1.8.1 → V1.9 moved to verified-only events (a stricter labelling invariant, ~7,500 events from ~13,500 candidates), added 5 FAO food-security indicators to the 69 World Bank ones, and widened the country scope from the 55 curated to all 214. Ground truth grew again to 649 pairs. Persistence dropped another 0.04.
So the honest read is: we're not producing a dramatically better model, but we are producing a model that holds up under a substantially more adversarial evaluation harness. For a statistical recipe system that hasn't changed its core algorithm since V1.8, that's the right kind of durability.
What this number does not prove
Margin over persistence is a ranking-quality metric. It tells you the model orders predictions usefully. It does nottell you the probability estimates are well-calibrated: that “HIGH” actually corresponds to 70% realisation rates rather than 40%.
For that, we look at Brier Skill Score. V1.9 crossed positive BSS on short- and medium-pattern tiers during validation (+0.017 and +0.009, first time in QGI's history). Test-phase BSS remained negative across every tier (−0.16 to −0.24). The validation-to-test gap is the clearest signal that the statistical recipe system is at a calibration ceiling.
What V1.9.1 changes, and what it doesn't
The release that shipped the same day as this post, V1.9.1 (Fix C), tightens the threshold logic that decides which countries end up in the HIGH risk tier. It fixed a diagnostic bug where 68% of scored countries were rated HIGH, including stable democracies whose top category was nothing more severe than “elections and voting.” The fix dropped the share to ~37%, inside the target band.
Because the fix changes tier-labeling rather than ranking, it doesn't move F1, doesn't move margin, and doesn't move any of the numbers in the chart above. The backtest metrics for V1.9.1 are identical to V1.9. We could have re-run the backtest and produced a V1.9.1 JSON with exactly the same numbers; we chose not to, since the run would have cost AWS credits for zero information gain.
The nextrelease, V1.9.2 (Fix D), will change the actual salience scores: it replaces per-country z-score normalization with cross-country per-category normalization. That one we will re-backtest, because the ranking changes. If the calibration ceiling moves, it'll show up in the next version of this trajectory chart.
What we're watching next
Two things. First, whether V1.9.2 lifts test-phase BSS into positive territory on at least one tier: that would be the first evidence the calibration ceiling is breakable without switching to a gradient-boosted model. Second, whether the margin keeps widening. Four releases with monotonically growing margin is a pattern worth watching; five would start to be a track record.
We'll post the V1.9.2 numbers when they land. Probably in 2-3 weeks.